RPA and AI for Government
Transforming Public Service Delivery through Automation

At a recent RPA and AI for Government virtual event
Vikash Kumar,
Manager Advanced Analytics and Modelling at the
Waka Kotahi NZ Transport Agency
delved into the
success stories of using data science, knowledge modelling, and AI to deliver measurable impact in the transport sector
His presentation explored:
Utilising knowledge graphs as a paradigm to organise your information
Delivering effective, production-ready Machine Learning models
Using data to make
better decisions
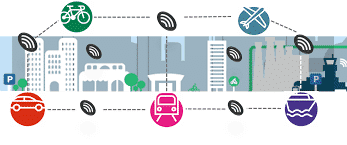
The transport sector in most cities and countries is one of the most complicated industries that exist. After all, it covers multiple modes, numerous networks and many different types of vehicles. Managing the sector can be an extremely complicated task, and as Vikash Kumar , the Manager of Advanced Analytics and Modelling at the Waka Kotahi NZ Transport Agency (NZTA) says, even in a small country like New Zealand “we work in a very complex ecosystem.” The NZTA is the “regulator of the land transport system,” which includes looking after roads and rail, as well as things like “driver licensing and vehicle registrations.” The goal is to look after the transport system and the people that use it in “a fair, equitable, healthy and sustainable manner.”
The NZTA is “an evidence-based organisation,” and also encompasses a “Centre of Excellence for Research and Analytics.” Within that are eight teams based around data, research, evaluation, insights, analytics, business intelligence and advisory, designed to assist the agency to make better decisions. The Advanced Analytics and Modelling team is one of the eight teams, and their goal is to “take data as our input and find the most appropriate scientific methods, processes, algorithms or systems to help deliver insights, evidence and experience to enable decisions. We are a conduit between data and decisions, and the expectation is that this will lead to a safer, better, cleaner and more equitable world.”
Their mandate is to work with “data, tools and skills.” Data comes in “different volumes, varieties and velocities,” whilst the tools are the methods of bringing them altogether, using “coding, modelling and other analytics.” The skills however are not just the ability to use the data and the tools, and require things like “maths, coding and data visualisation skills,” but are also about having soft skills. These include “having good communication skills, being able to talk to business analysts and translate problems into real-world examples,” and there is also a “big focus on lifelong learning, being able to play as part of a team, and thinking about the ethical side of things for all of our projects.” These skills come into play particularly when the team has to deal with “complex datasets,” which is very common in the transport sector.
Using data and analytics in new ways

One of the major global areas of focus in 2021 in industries that deal with data, is having “composable data and analytics.” Essentially this is about stripping things down into their smallest, independent components, “a little like Lego bricks,” and then composing them into solutions that fit together in “modular, easy-to-use and reusable ways.” It is also about decoding tools so that they can “seamlessly talk to each other.” Ultimately, in our ever-changing world with constant technological advances, it is about having tools and “architectures that enable flexibility.” This was the case previously but has really become the focus for 2021 because of COVID-19. The pandemic has created the need to be extra “resilient and adaptable.”
“If a small component of your product fails, the expectation now is that you can fix it or replace it and hope that the rest of the product keeps working without too much disruption. Previously you would have to replace the whole product, which was not only expensive but time-consuming”
It used to be that in the world of data analytics, having something work at “90% or 95% accuracy was sufficient.” That is no longer the case. The expectation now is that things work perfectly all the time, and can quickly be fixed or updated if there is ever a problem. Therefore, using “those modular, reusable components is the way we have to work now.” In practice, at the NZTA, this has meant overhauling and rebuilding some of the IT and data systems that “were previously done elsewhere outside of the agency” in order to get a more holistic picture of the “national land transport system across New Zealand,” and to plug any holes as they appear. Though there was an initial outlay required to build these systems, doing so has already resulted in “more than $2 million in savings in 2021.” Some of these projects include things like:
- Weather activated variable speed limits – In areas where the roads “can be dangerous in wet weather conditions, we deployed a program that analyses that and changes the speed limits to hopefully avoid serious crashes.”
- Highway longevity – “Nationally it’s important to know when a certain section of road, based on the terrain and local weather conditions, has extra wear, so that we can schedule maintenance. The model predicts the renewal and the conditions of the road.”
- Journey planner – “This is a very popular app. Whenever there is a long weekend or holiday in particular, people use it to plan their journey and to see where the bottlenecks are across the road network. We also release advised safe times to travel.”
- Transmission Gully Motorway – A new road is being built out of Wellington. There is already an expectation that when it opens in September 2021 there will be a lot of data, “so we are building a system that will monitor that in real-time. We have already built a system that monitors key customer and freight journeys across the country, so we have experience with this.”
Aside from new projects, one of the other new trends in data visualisation relates to graphs. Obviously, that is not a new concept but “we see a lot of value in that data representation format.” Given how much data there is about the transport network and how complex some of the analysis is, it is important to “be able to see the whole network of operators, drivers, etc.” Just in the research team alone, there are currently “around 90 full-time employees working on more than 300 projects.” Much of that is currently recorded in an Excel spreadsheet, but that is hard to see and fully appreciate, and it is particularly difficult to see “what are the core outputs and how it aligns to our core portfolios of work. It gets very complicated very quickly.”
Recently much of the data from the spreadsheet was transferred into a representation that is actually all visible on one page, though admittedly the details are quite small. Nonetheless, with colour coding and an ability to “zoom in and out,” all the projects, business groups, insights and personnel can be seen. “We have broken down the work into 18 or 19 portfolios, and if you click on them, you can see all the connections.” Most importantly, this project, like so many of the others is about accessibility modelling and is “ supporting the strategic performance reporting for transport services, as well as delivering new insights.”


