

The Report Factory
Public sector organizations run on projects. IT modernization, infrastructure programs, policy initiatives, service transformations: at any moment a ministry, agency, or municipality is delivering dozens or hundreds of them at once, and leadership is accountable for all of them. Yet ask an executive how the portfolio is doing this week, and the answer usually depends on a document somebody built by hand.
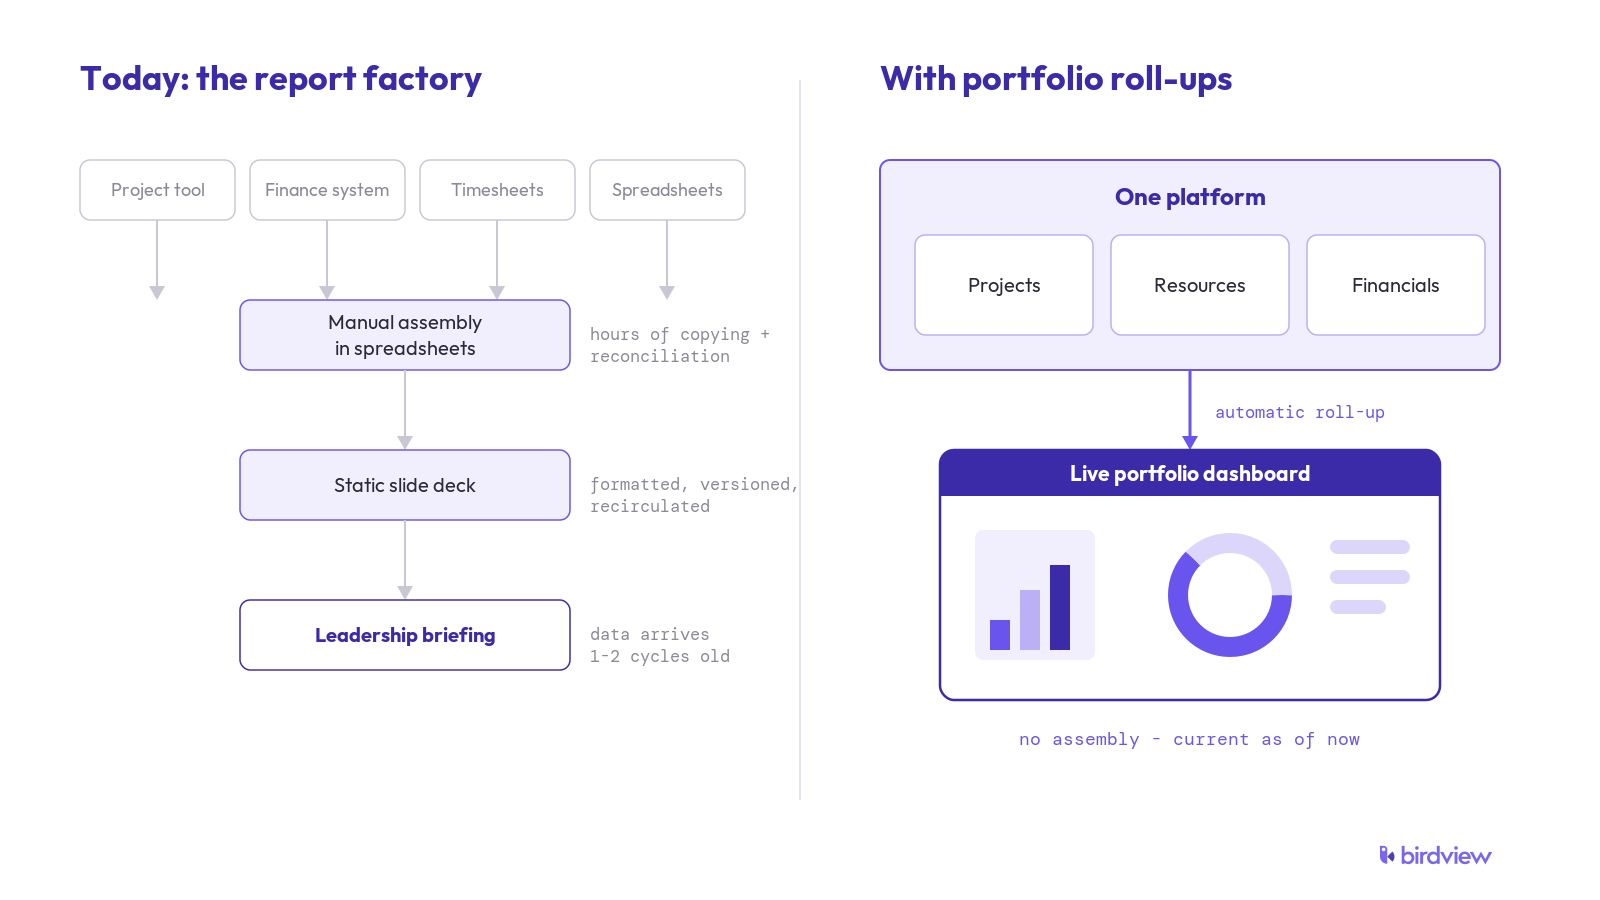
That is because in most organizations, project and portfolio reporting is manufactured, not generated. An analyst pulls task status from the project tool, budget actuals from the finance system, effort data from timesheets. The pieces are reconciled in a spreadsheet, formatted into a slide deck, circulated for corrections, and presented at the executive table. Then the cycle starts again for the next reporting period.
Call it the report factory. It has three defining characteristics: it consumes skilled people, it produces a portfolio picture that is already old, and nobody ever decided to build it. It accumulated, one tool and one workaround at a time, as the project portfolio grew faster than the systems meant to track it.
The instinct is to treat this as a reporting problem and fix it with a better template or one more dashboard. It is not a reporting problem. It is an architecture problem. When project, resource, and financial data live in separate systems, every portfolio report is a small manual integration project, and no template fixes that.
What Manual Assembly Actually Costs
Analyst capacity. The people assembling status decks are typically the same analysts and coordinators the organization hired to do analysis. Every hour spent copying figures between systems and reconciling totals is an hour not spent asking what the figures mean. Across a portfolio of any size, report assembly quietly becomes a standing line item paid in staff time.
Data age. A deck assembled over several days and presented the following week describes the portfolio as it was, not as it is. Decisions about reallocating people or funding are made against a picture that is one to two reporting cycles old. In a fast-moving program, that lag is the difference between correcting a project and conducting a post-mortem on it.
Version disputes. When finance exports its numbers from one system and delivery exports theirs from another, the first fifteen minutes of the briefing are spent arguing about whose numbers are right. The dispute is rarely about arithmetic. It is about two systems that count different things at different times. Meetings that should allocate resources instead adjudicate spreadsheets.
Decision latency. When answering a follow-up question requires commissioning another report, questions stop being asked. Leadership learns to work with the deck it was given, and the organization loses exactly the curiosity that oversight is supposed to provide.
Reading the Signals
How do you know whether your organization has an architecture problem rather than a reporting problem? The signals are consistent:
- Producing the monthly portfolio review takes days of staff effort, every month.
- The same metric appears with different values in different meetings.
- Leadership cannot answer "how are we doing this week" without requesting a report.
- Follow-up questions take days to answer because they require new data pulls.
- Analysts describe their job as "putting the deck together" rather than analysis.
- Every new oversight requirement (a new committee, a new audit, a new mandate letter commitment) adds another manual report to the factory rather than another view on existing data.
Any one of these is friction. All of them together describe an organization whose decision-making speed is capped by its reporting supply chain.
The Fix: Three Layers, One Source
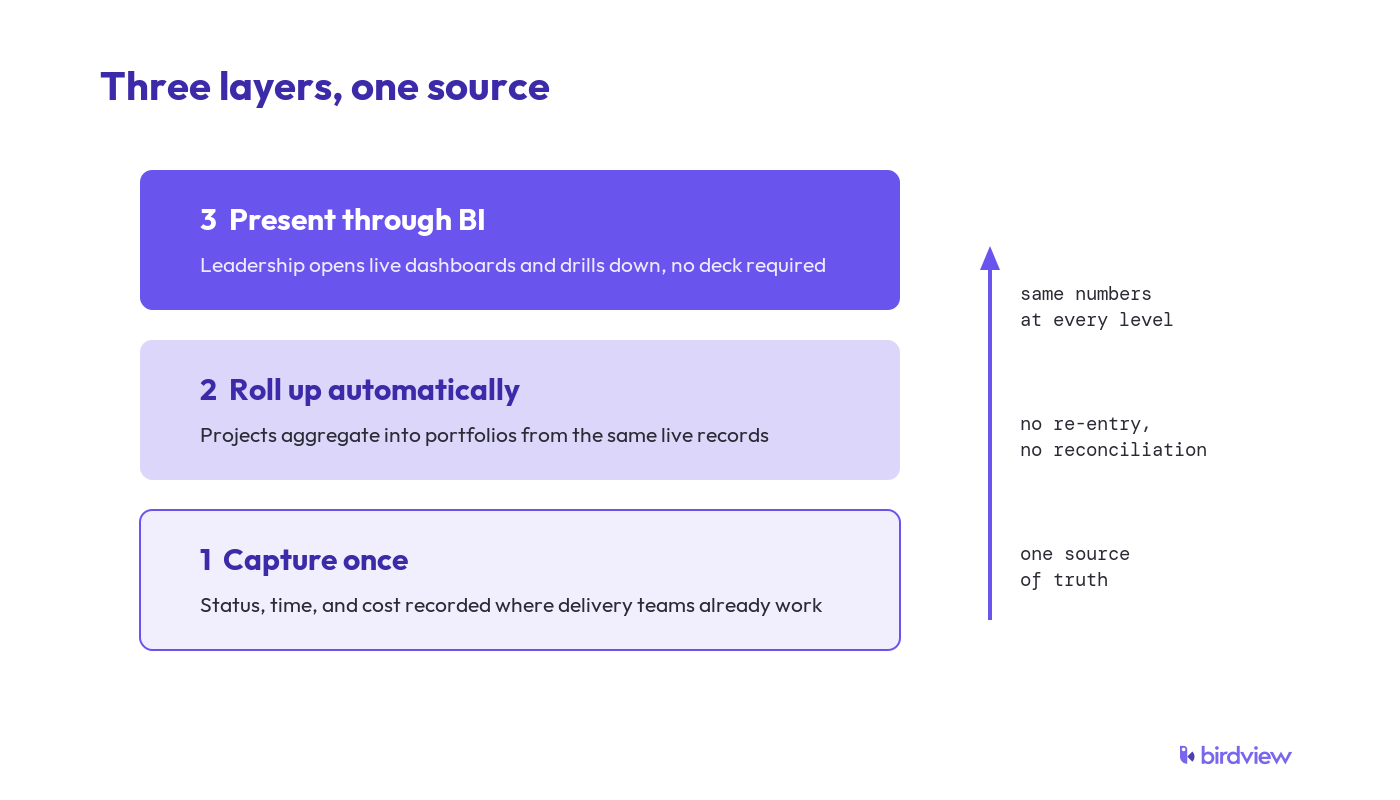
The organizations that have escaped the report factory did not buy a better presentation tool. They changed where reporting comes from. The working model has three layers.
Capture once. Project status, task progress, time, and cost data are recorded in the same platform where delivery teams actually work. Nothing is re-entered for reporting purposes. This is the layer most organizations already believe they have, until they count how many supplementary spreadsheets orbit their project tool.
Roll up automatically. Projects aggregate into programs and portfolios without human assembly. Portfolio health, budget consumption against plan, and resource capacity are computed from the same live records the delivery teams update, not from copies of copies. A roll-up is only trustworthy when every number in it comes from one source; this is the layer that eliminates the version dispute.
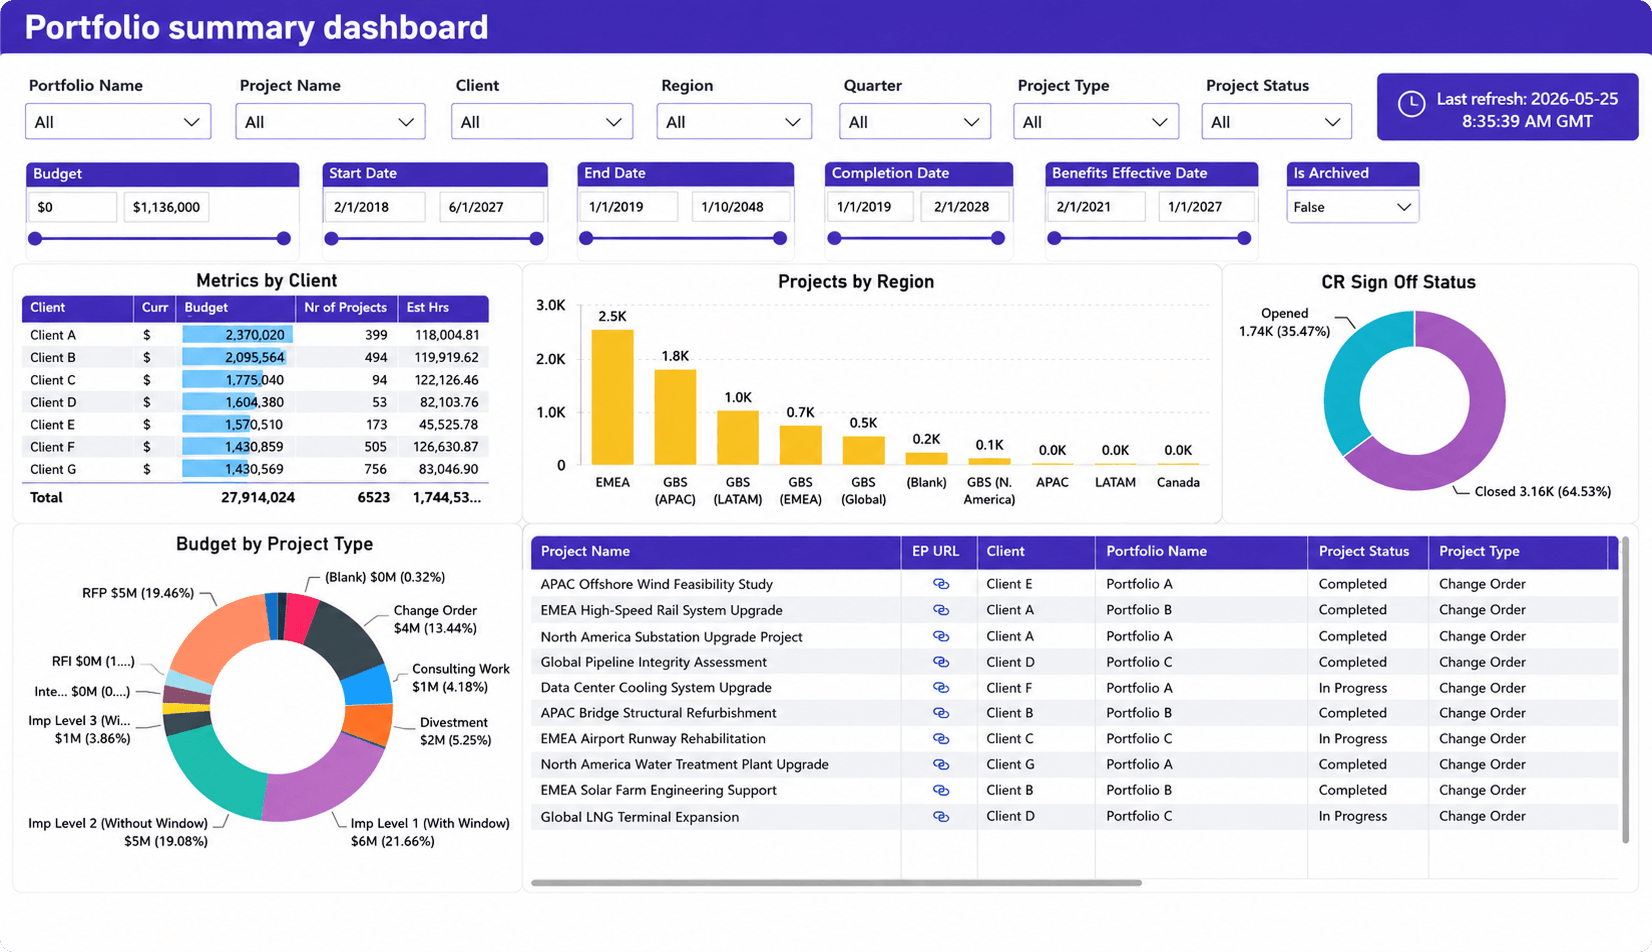
Present through BI. The leadership interface is a dashboard, not a deck. Executives open the portfolio view themselves, see data that is current as of now, and drill from portfolio to program to individual project without commissioning anything. The analyst's role shifts from assembling the picture to explaining it, which is the job the organization needed all along.
The strategic point about consolidation follows from the model rather than preceding it. A single platform is not primarily about reducing license count. It is about the fact that roll-ups and self-serve dashboards are only as credible as their source data, and source data is only consistent when the capture layer is unified. Organizations that keep five tools and buy a sixth to aggregate them have automated the report factory, not retired it: every integration between tools is one more place where numbers diverge and one more thing to maintain.
A Maturity Model for Portfolio Visibility
Level 1: Spreadsheet assembly. Data lives everywhere, reports are built by hand, and the organization runs on attachments. Most organizations recognize themselves here with some embarrassment; they should not, since this is where accumulated tooling naturally leads.
Level 2: Point tools with manual roll-up. Delivery teams have a project tool, finance has its system, and the report factory bridges them. Better data hygiene, same architecture.
Level 3: Integrated platform. Projects, resources, time, and costs are captured in one system. Roll-ups are automatic and consistent. Reporting effort drops sharply, though the leadership interface may still be periodic exports.
Level 4: Self-serve portfolio intelligence. Leadership consumes live dashboards directly, drills down without intermediaries, and analysts spend their time on interpretation and forecasting. New oversight requirements are met with a new view, not a new manual report.
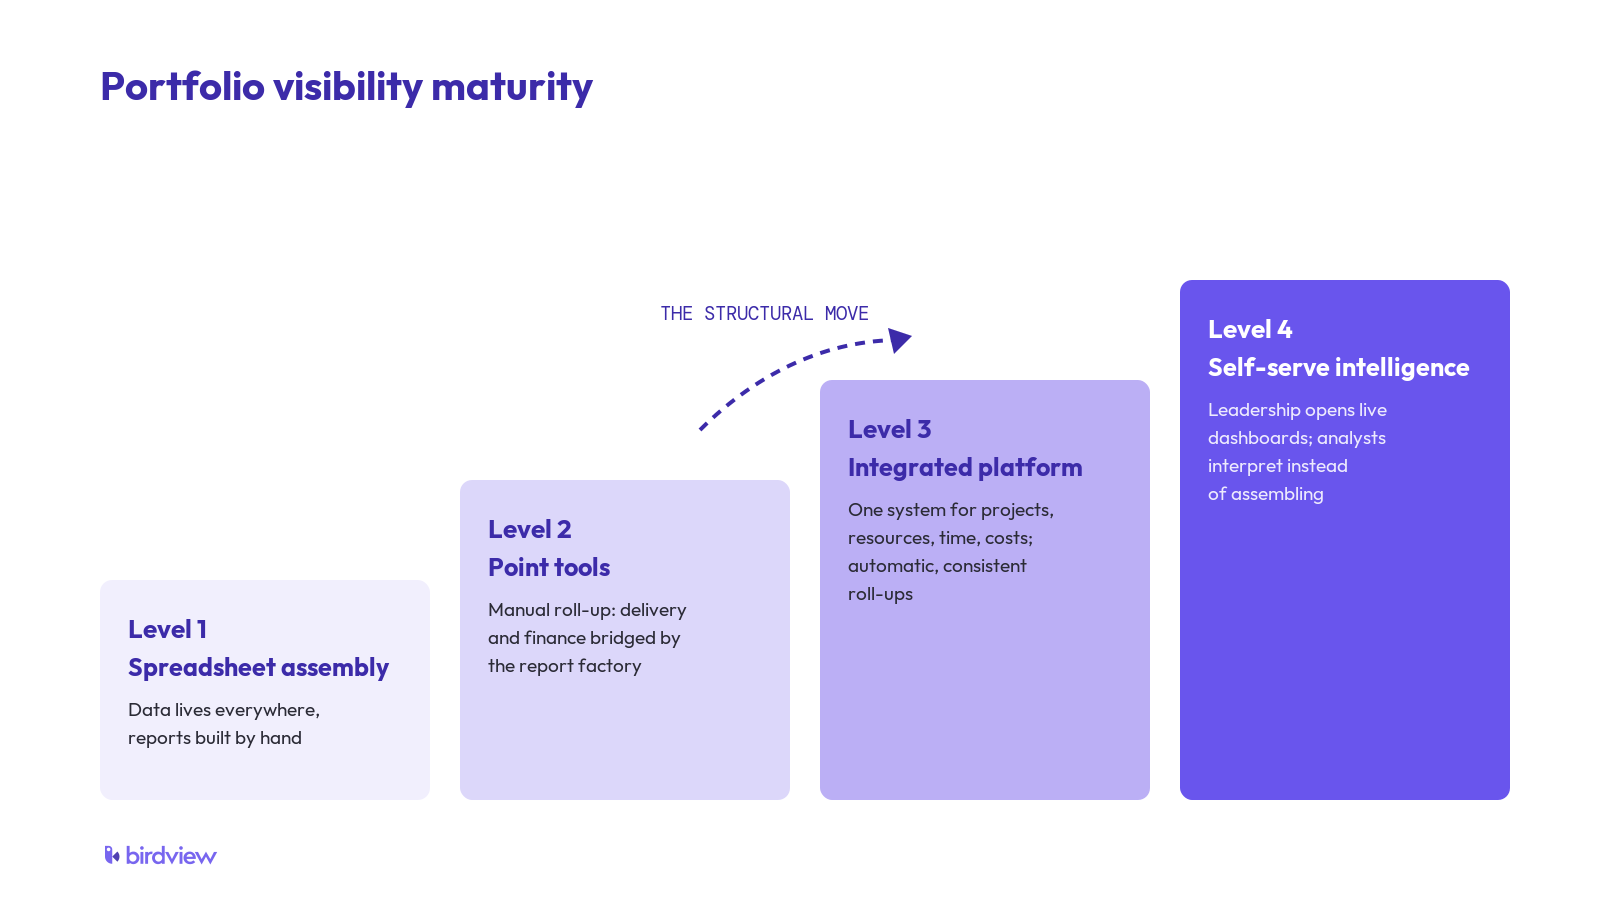
The move from Level 2 to Level 3 is the structural one, and it is where the time savings concentrate. The move from 3 to 4 is cultural as much as technical: it requires leadership willing to open a dashboard instead of waiting for a deck.
Questions That Reveal Where You Stand
For leaders who want a quick diagnostic, three questions do most of the work. Does producing your standard leadership report require a human to move data between systems? Can an executive see the current state of the portfolio without asking anyone? When finance and delivery present in the same meeting, do they cite the same numbers? An organization that answers no, no, and no is spending its analytical capacity feeding the factory, and the capacity is recoverable.
How Birdview Approaches This
Birdview PSA is a Toronto-built project and portfolio management platform used by federal government and Ontario provincial organizations. It implements the three-layer model directly: teams plan, track time, and manage costs in one system; portfolio roll-ups are computed from live data; and the BI layer ships with more than 250 pre-built Power BI dashboards and reports covering portfolio health, resource capacity, and project finances. Customer data is hosted on Microsoft Azure Canada Central, and Birdview, as a Canadian-incorporated company, is not subject to foreign compelled disclosure laws such as the US CLOUD Act, a consideration covered in our whitepaper on data sovereignty for the Ontario public sector.
Closing
The report factory persists because each of its costs is individually tolerable: a few days of assembly here, a stale number there, one more meeting spent reconciling totals. What is not tolerable is the sum, an organization where the people hired to think spend their time copying, and the people empowered to decide work from last month's picture. The architecture that fixes it is well understood: capture once, roll up automatically, present through BI. The only question the maturity model asks is how far along that path your organization has decided to be.

Published by
About our partner
Birdview
Birdview PSA is a project and portfolio management platform developed and headquartered in Toronto, Ontario. Birdview provides government organizations with portfolio-level visibility across projects, resources, and budgets, including workload and capacity planning, time tracking, cost control, and more than 250 pre-built PowerBI reports and dashboards.The platform is designed to meet Canadian data sovereignty requirements. Customer data is hosted in Canada on Microsoft Azurel, the platform is SOC 2 Type II certified. As a Canadian-incorporated company, Birdview is not subject to United States compelled disclosure legislation such as the CLOUD Act.Organizations typically adopt Birdview as a replacement for Microsoft Project Online, desktop Microsoft Project, or spreadsheet-based project tracking, consolidating these into a single platform supported by machine learning forecasting and an integrated AI assistant.Birdview is trusted by the federal government and Ontario provincial agencies, as well as regulated and project-driven institutions across Canada.
Learn more


Help your peers
Share what you've learned with fellow public servants