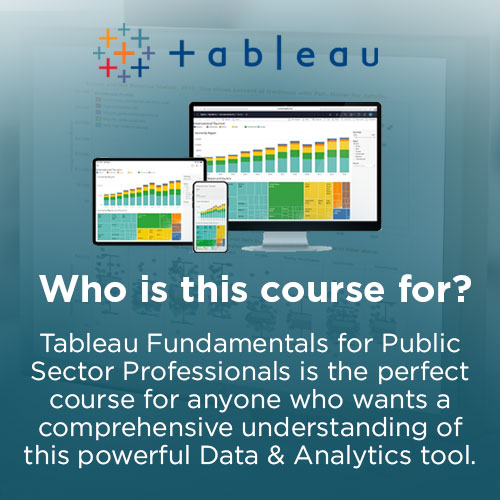
Is your team trying to turn data assets into actionable insights?
Tableau, the market-leading data discovery and visualization tool, allows you to quickly connect to files and database tables, discover relationships, and securely publish dashboards and other visualizations. And the best part is that Tableau’s intuitive user interface and straightforward formula language make fun to learn and a pleasure to use. If you can learn Excel then you can learn Tableau.
We are excited to invite you to our first virtual event with Tableau expert and trainer Lukas Halim. No matter if you are the resident data guru in your business or just learning the ropes, please consider joining us for this comprehensive look at the Tableau Fundamentals.
With Lukas’s expert guidance you’ll create charts, custom calculations, geographic maps, dashboards and more. Join us and take your data skills to the next level.

MEET THE FACILITATOR

Lukas earned his Masters in Analytics from NC State in 2013 and has eight years experience as a data scientist in the health insurance industry. Using tools such as SAS, Python, Tableau, and Teradata, he conducts analysis to improve healthcare affordability and customer engagement. Projects include pilot and retrospective analysis, predicting opioid overdose, and developing and prototyping methodology for measuring utilization management savings. He’s also a popular instructor on Udemy, where he’s taught Tableau to more than 70,000 students and professionals.
THE COURSE CURRICULUM
This government tailored training taking place over three consecutive business days is designed to help you develop the fundamental skills in bit size chunks; skills that will be directly applicable to your day-to-day business activities. The staggered approach enables you time to digest the information, put it into practice and return the following morning to pick up where you left off, with your new information still fresh in the memory. The final day will culminate in a personal project where you will demonstrate your newly acquired skills and develop your own stunning Tableau report. You can then share these dashboards with teams, business partners and publish them to the web.
The Course will be run on:
Tuesday 22/11/2022 – 9:00am – 11:30am (AEST)
Wednesday 23/11/2022 – 9:00am – 11:30am (AEST)
Thursday 24/11/2022 – 9:00am – 12:00pm (AEST)
EARLY BIRD TICKETS ARE SURE TO SELL OUT FAST, GET IN WHILE YOU CAN!
The course will cover the following topics and more:
- Overview of Tableau Desktop – Introduction to Tableau Desktop: Data Sources, Worksheets, Dashboards, Stories
- Connecting with your data sources – Connecting to a data source: connect to file data, editing fields, discuss connecting to databases, adding data source filters
- Creating a worksheet – Creating tables and basic charts: cross tab, bar chart, line chart, scatter plot Dimensions & Measures, discrete and continuous
- Dual axis charts & combo charts – Define, show how to create, show how to sync axes
- Mapping – Understand geocoding, Using Geographic fields, correct ambigious locations
- Sorting – Sort ascending, descending, manual, hierarchical
- Filtering – Filtering on dimensions, measures, dates
- Hierarchies, Groups, and Sets – Built-in date hierarchy, create your own hierarchy
- Parameters – Use parameters in a calculation, use parameters for filtering
- Analytics – Exploring distributions – Reference Lines, Box Plots, Histograms
- Analytics – Trend Lines & Forecasts – Trend Lines, Forecasts
- Calculations – Row, aggregate, table Quick Table calculations
- Formatting – Color, Fonts, Size, Tooltips, borders, shading
- Dashboards – Add worksheets to a dashboard Dashboard Layout – floating vs tiled. Add interactive elements for consumers (e.g. show filters, data highlighter, tooltips). Add dashboard actions (e.g. filter action, highlight action, parameter control, URL action). Configure a dashboard layout and create device-specific dashboards.
- Stories – Steps to create a story. When to use dashboards vs stories
- Publishing to Tableau Public
- Combining Data Sources – Joins, Unions, and Relationships
- Discuss principles of effective visual design
- Final Project – Time creating a visual with a new dataset, possibly one from Makeover Monday.
Registration
5% discount will be offered to group registrations of more than 10 learners
10% for group registrations of more than 20 learners
For group discounts please contact us at [email protected]


